 By James
 Most “file size statistics” online are ten-year-old survey numbers quoted from one another. This report is different: it is measured. xconvert.com is a free online file conversion and compression service, and between 5 August and 3 September 2026 it processed 374,149 conversions and 10 terabytes of uploads. We aggregated every one of them (sizes, formats, timings and outcomes – never file contents) to answer the questions people actually search for: what gets converted most, how much compression really saves, how big files are in 2026, and why people shrink video at all. Every number below is free to cite and every chart is free to embed with a link back to this page.
Quick answer: In 30 days, xconvert users uploaded 10.05 TB across 374,149 jobs. Compression jobs took 5.8 TB down to 2.8 TB – a 52% overall reduction, but the median saving ranges from 83% for PDFs and 82% for TIFFs down to 25% for HEIC, which is already efficient. The single most common job is MP4 to GIF (32,594 jobs), and it makes files 5.1x larger at the median. 54% of videos brought to the compressor are over 25 MB and 28% are over 100 MB. The median job finishes in 21 seconds; the median user downloads the result 108 seconds after uploading.
Jump to a section
- Headline numbers
- What people convert most
- How much compression really saves, by format
- What converting a file does to its size
- How big files are in 2026
- Why people compress video: the platform limits
- Merging, speed and behaviour
- When and where files get converted
- Format trends: spring vs late summer 2026
- Methodology, citing and embedding
- FAQ
Headline numbers
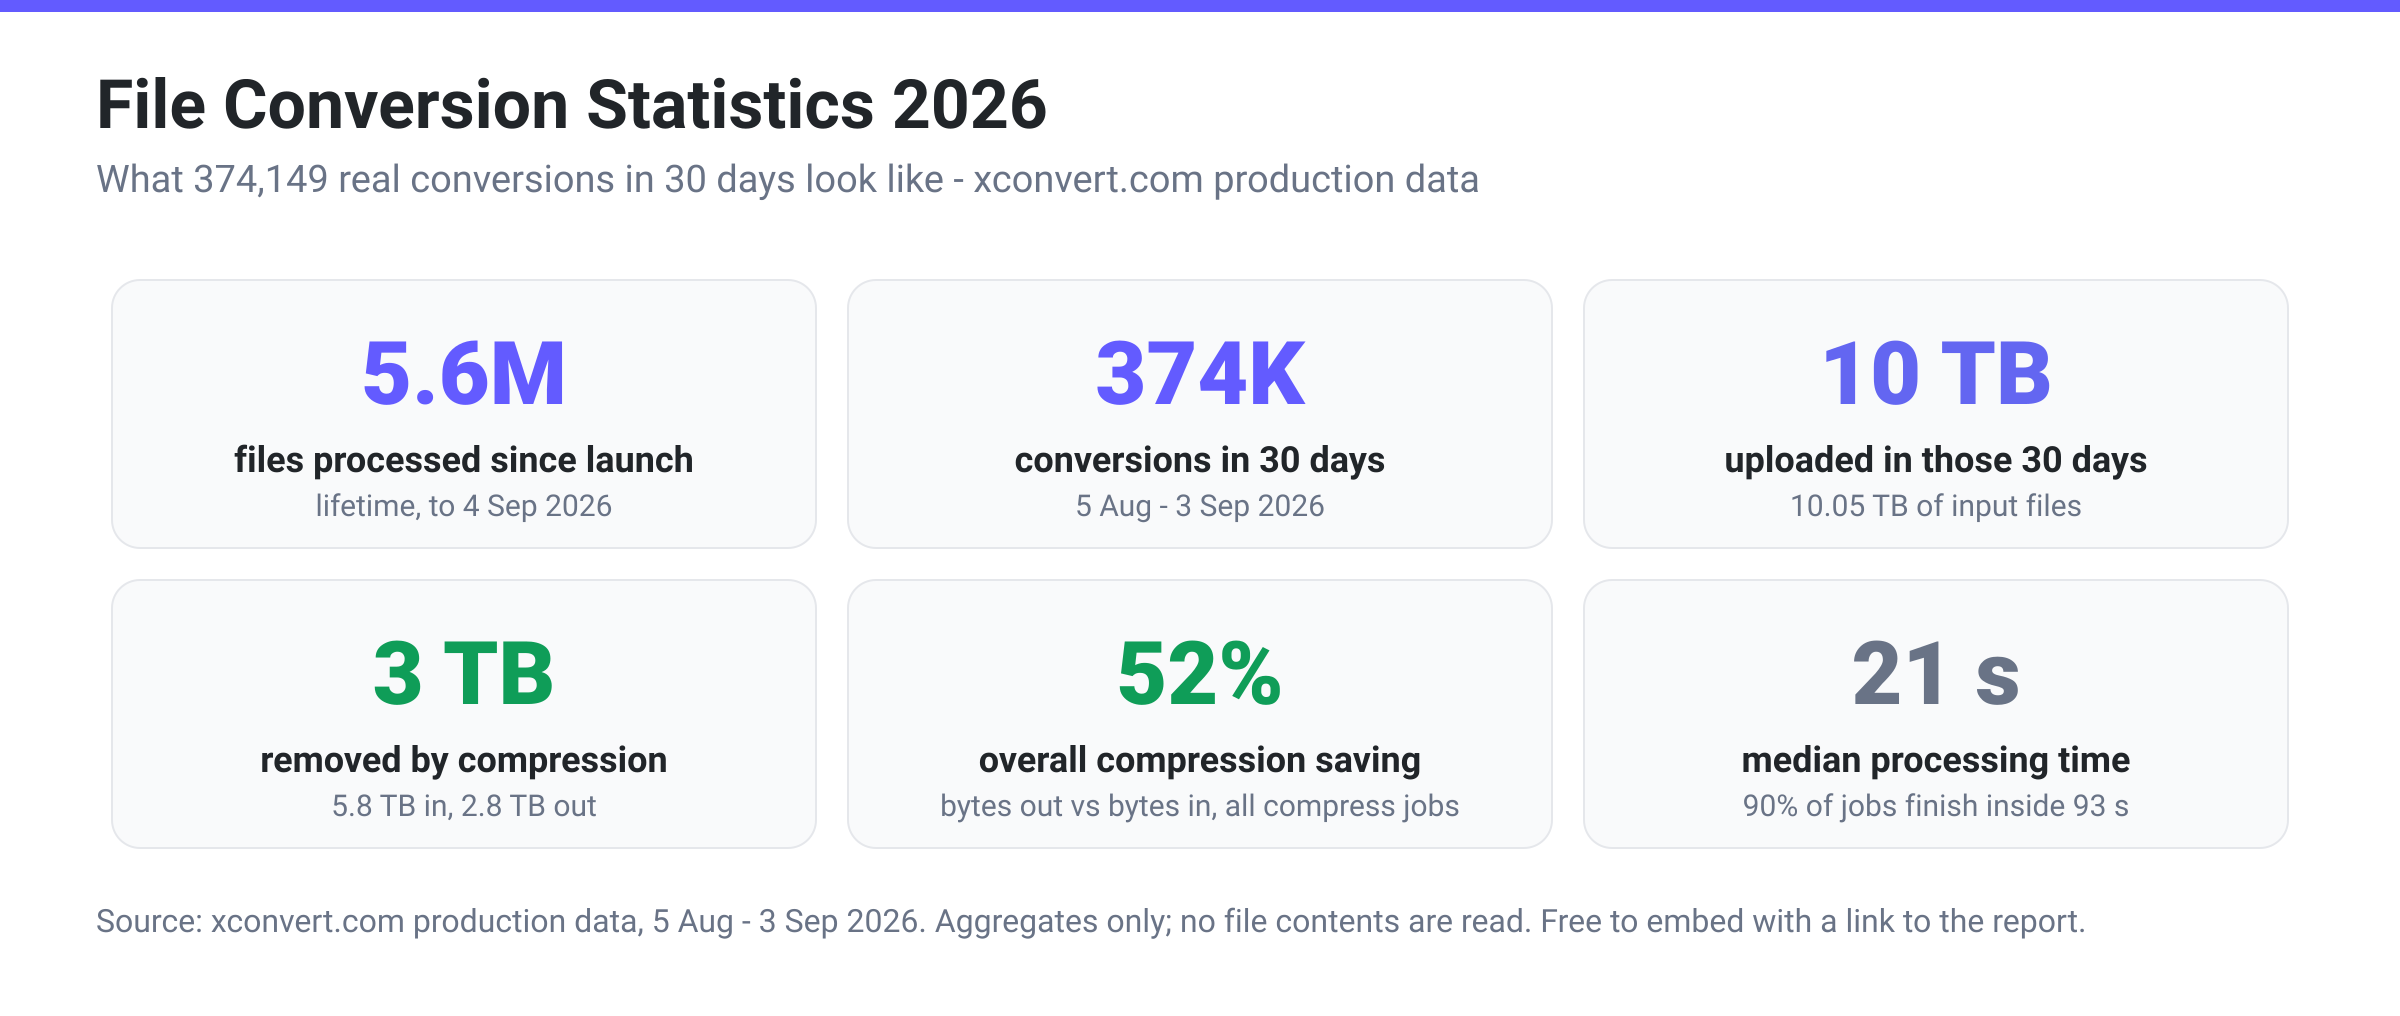
| Statistic | Value |
|---|---|
| Files processed since launch | 5,606,005 (to 4 September 2026) |
| Conversions in the 30-day window | 374,149 |
| Data uploaded in the window | 10.05 TB |
| Compression jobs | 138,300 |
| Bytes into compression jobs | 5.80 TB |
| Bytes out of compression jobs | 2.78 TB |
| Removed by compression | 3.02 TB (52.1%) |
| Median processing time | 21.3 seconds (90th percentile: 92.8 s) |
| Failure rate | 1.5% (5,662 jobs) |
| Jobs that ended in a download | 293,014 (78.3%) |
| Monthly volume, March to August 2026 | 352K, 389K, 456K, 389K, 418K, 386K |
The job mix is 57.8% conversions, 38.2% compressions and 3.8% merges, with a small tail of split, extract and archive jobs.
What people convert most
The top of the list is not a document format. It is a meme format.
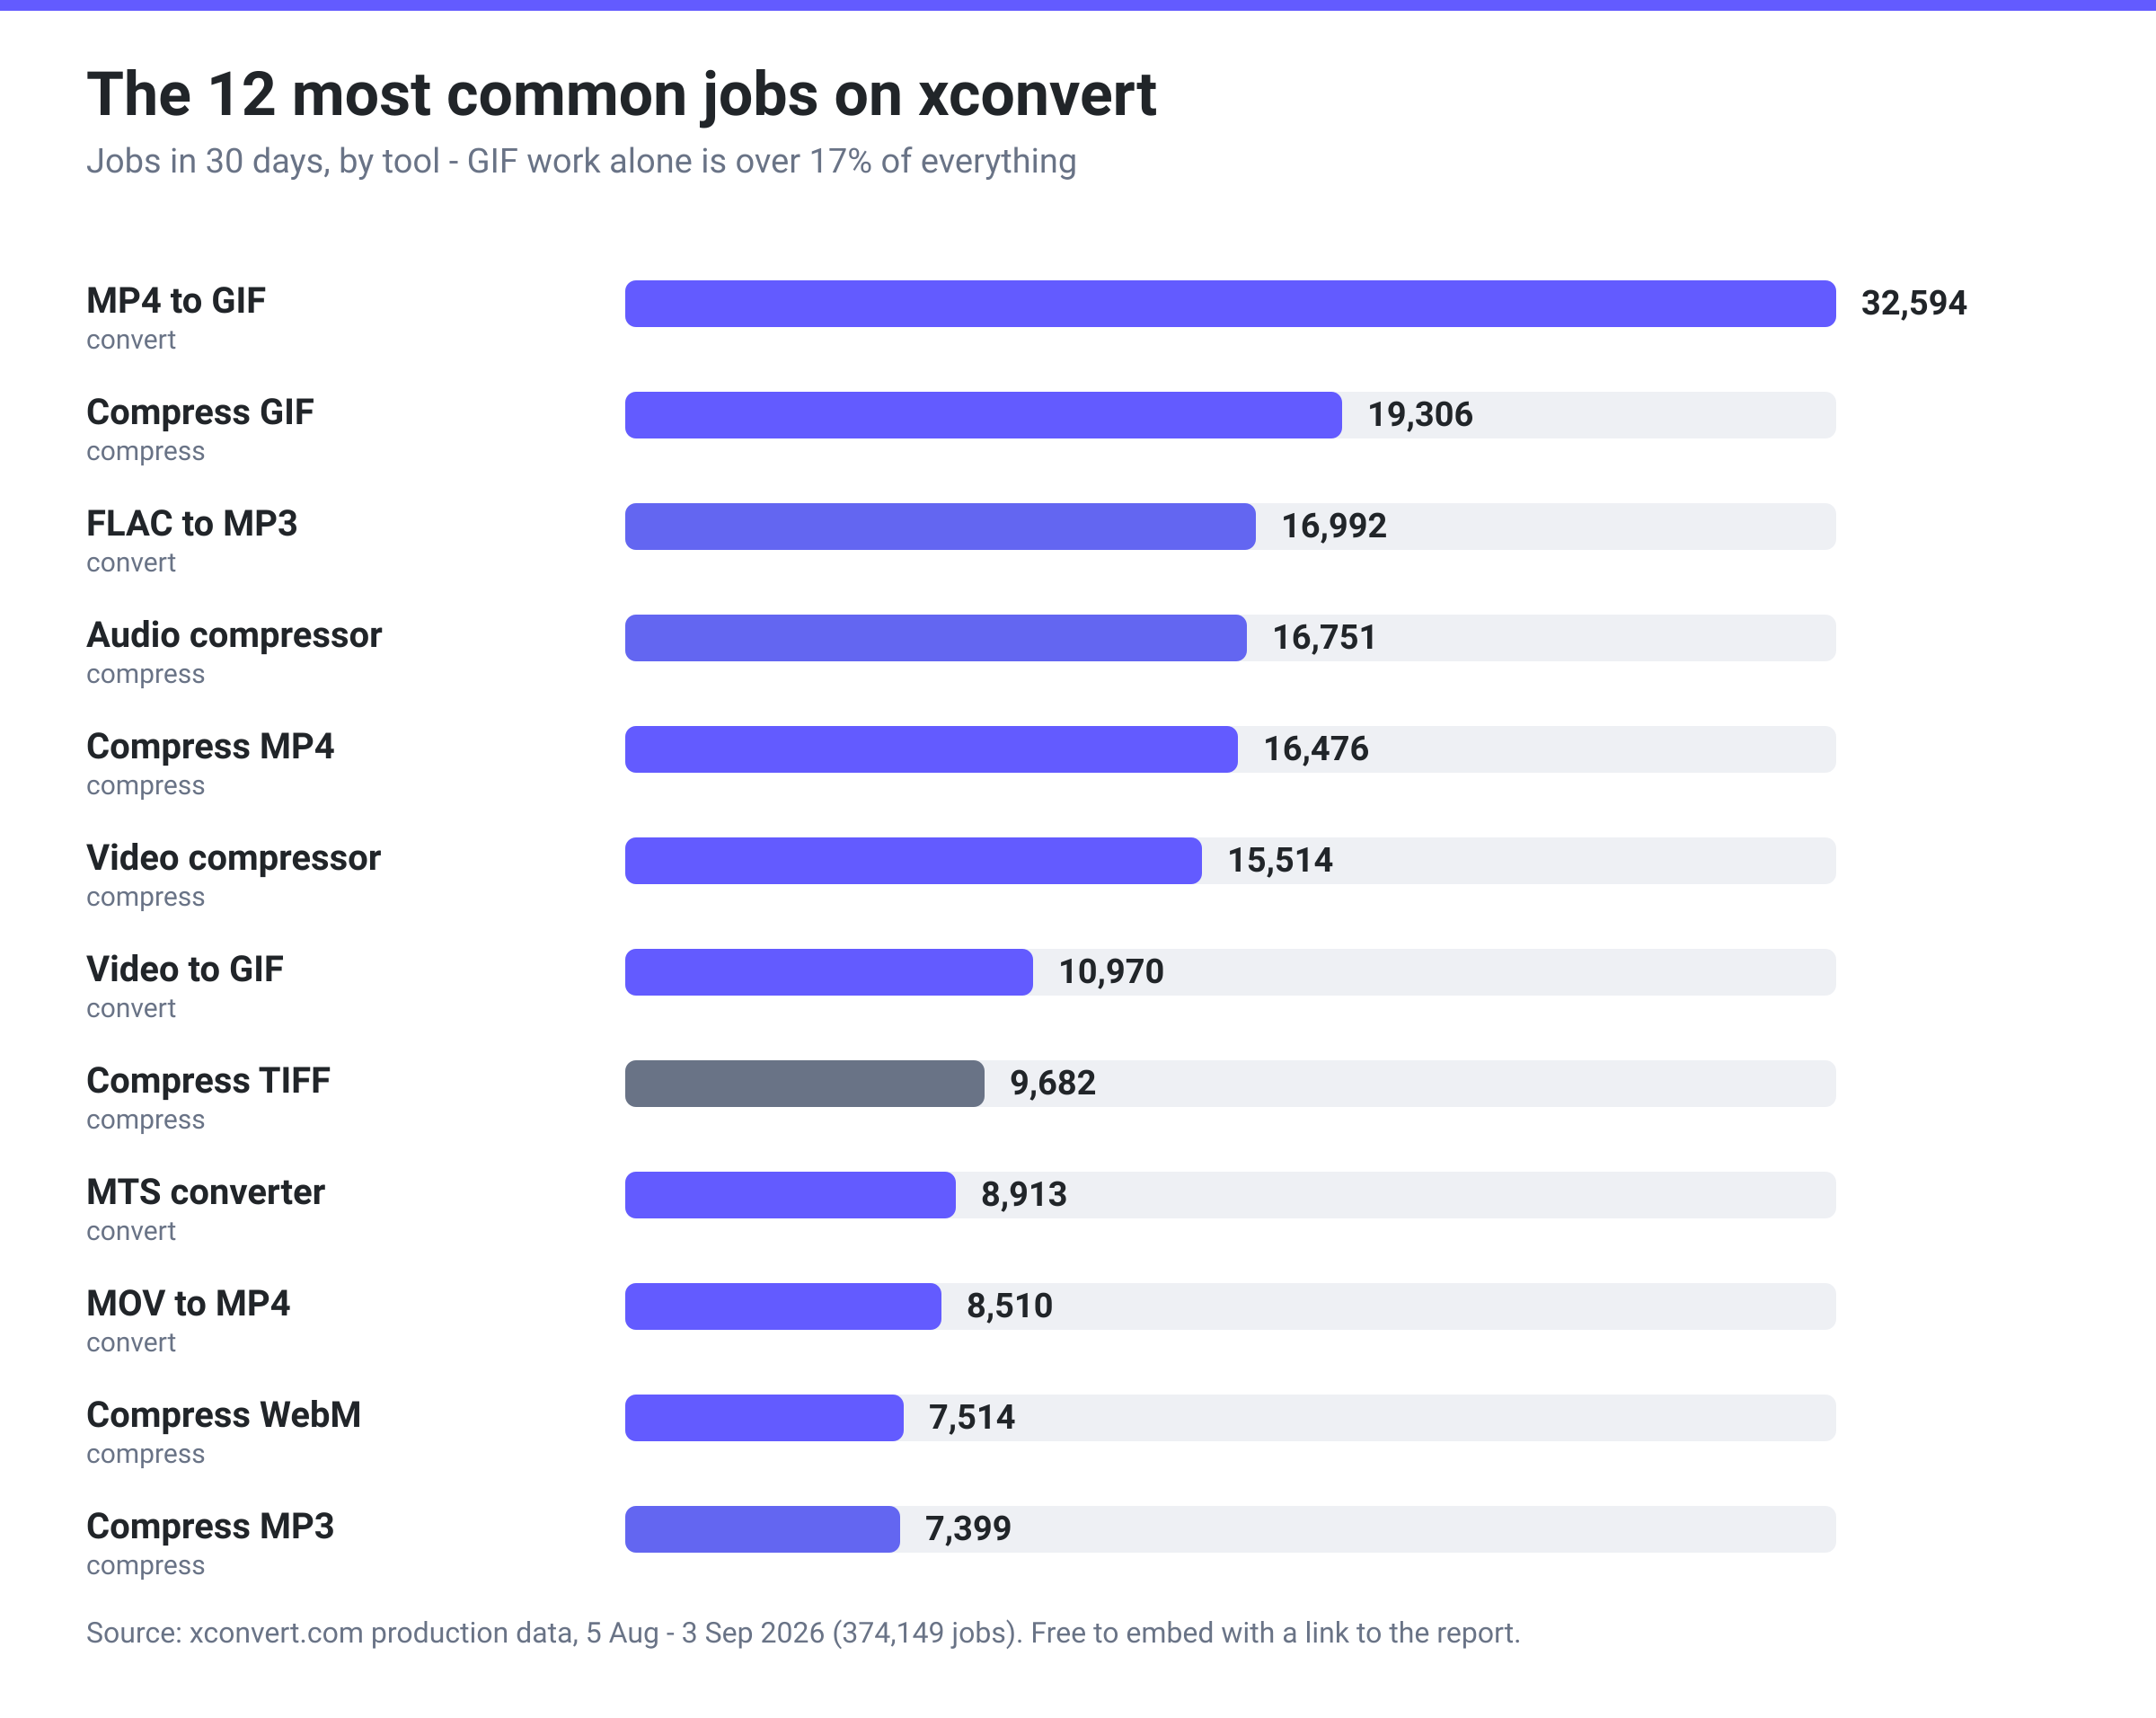
| Rank | Job | Jobs in 30 days | Failure rate |
|---|---|---|---|
| 1 | MP4 to GIF | 32,594 | 0.6% |
| 2 | Compress GIF | 19,306 | 0.7% |
| 3 | FLAC to MP3 | 16,992 | 0.4% |
| 4 | Audio compressor | 16,751 | 1.0% |
| 5 | Compress MP4 | 16,476 | 0.9% |
| 6 | Video compressor | 15,514 | 1.6% |
| 7 | Video to GIF | 10,970 | 0.6% |
| 8 | Compress TIFF | 9,682 | 2.2% |
| 9 | MTS converter | 8,913 | 0.9% |
| 10 | MOV to MP4 | 8,510 | 0.8% |
| 11 | Compress WebM | 7,514 | 3.8% |
| 12 | Compress MP3 | 7,399 | 0.7% |
| 13 | Compress HEIC | 7,330 | 0.3% |
| 14 | WebP to MP4 | 7,206 | 0.1% |
| 15 | Compress PNG | 7,022 | 0.9% |
Three patterns stand out. GIF is still enormous: MP4 to GIF, compress GIF, video to GIF and MOV to GIF together account for 64,655 jobs, over 17% of everything. Audio is a serious share of the work, not an afterthought: FLAC to MP3, the audio compressor, compress MP3, MP3 to WAV and compress WAV add up to 49,745 jobs. And camera and phone formats drive the image side: HEIC (12,912 jobs across compress and convert), MTS camcorder footage (8,913), and RAW photo formats (CR2, CR3 and ARW: 9,323 jobs) show that a large part of “file conversion” in 2026 is really “make what my device produced usable somewhere else.”
How much compression really saves, by format
Every compression job records the bytes in and the bytes out, so this is the real answer, not a vendor claim. The figure is the median per-job saving, with the interquartile range showing how much it varies.
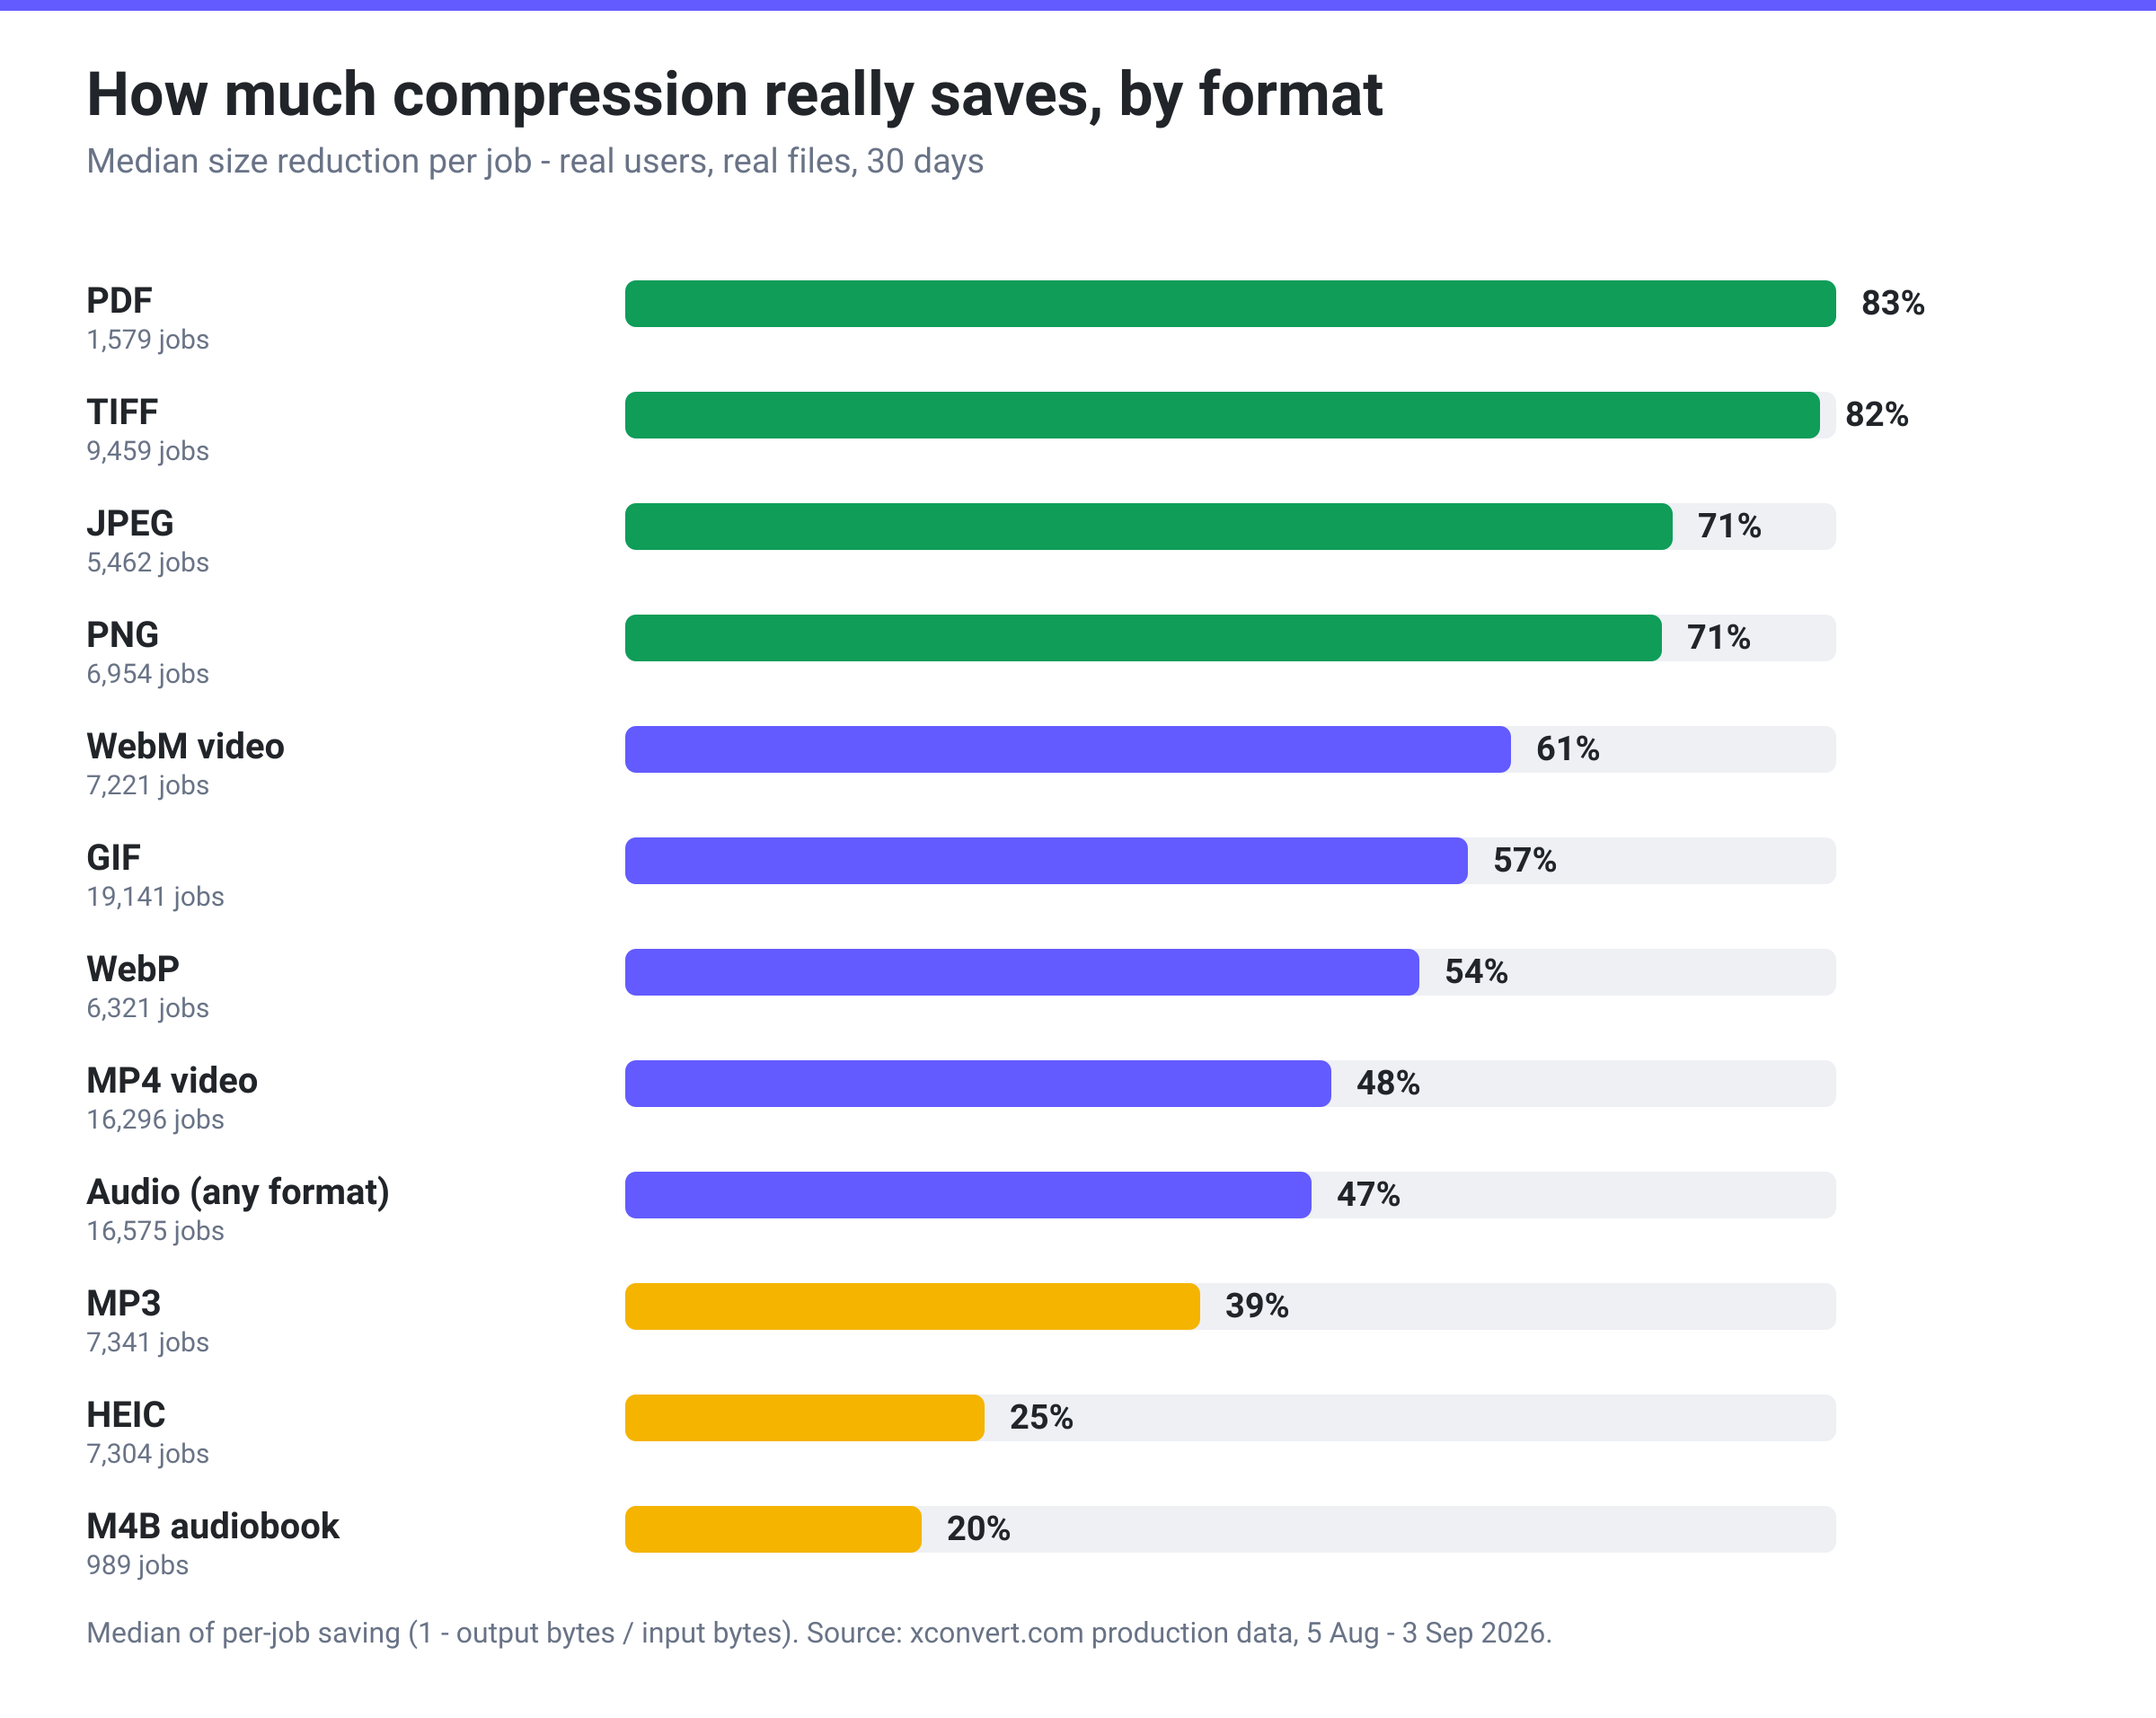
| Format | Jobs | Median size before | Median size after | Median saving | Middle 50% of jobs |
|---|---|---|---|---|---|
| 1,579 | 3.0 MB | 0.52 MB | 83% | 43% to 93% | |
| TIFF | 9,459 | 8.2 MB | 0.99 MB | 82% | 54% to 95% |
| JPEG | 5,462 | 1.5 MB | 0.28 MB | 71% | 42% to 87% |
| PNG | 6,954 | 2.7 MB | 0.66 MB | 71% | 61% to 84% |
| WebM video | 7,221 | 4.4 MB | 1.8 MB | 61% | 40% to 82% |
| GIF | 19,141 | 14.6 MB | 5.7 MB | 57% | 35% to 78% |
| WebP | 6,321 | 0.24 MB | 0.09 MB | 54% | 27% to 80% |
| MP4 video | 16,296 | 41.3 MB | 15.4 MB | 48% | 20% to 73% |
| Audio (all formats) | 16,575 | 9.3 MB | 3.2 MB | 47% | 25% to 75% |
| MP3 | 7,341 | 6.6 MB | 3.5 MB | 39% | 23% to 68% |
| HEIC | 7,304 | 2.3 MB | 1.3 MB | 25% | 21% to 65% |
| M4B audiobook | 989 | 295 MB | 235 MB | 20% | 20% to 21% |
The ordering is a lesson in where the fat is. PDFs and TIFFs shed the most because they so often carry uncompressed scans or print-resolution images that nobody needs at that size. PNG is the most predictable win: half of all PNG jobs land between 61% and 84% savings, the tightest band of any lossy-tolerant format, which is why compressing a PNG is close to a free lunch for web images. HEIC sits at the bottom for the opposite reason: Apple’s format is already a modern, efficient codec, so there is simply less to remove. And the audiobook row is the purest example of a format already near its floor: nearly every M4B job saves almost exactly 20%, because the encoder is only trimming bitrate headroom.
MP4 is the interesting middle case. Half of all video compression jobs save less than 48%, and a quarter save under 20%. Video is where users most often ask for a specific target size rather than “as small as possible”, and the data reflects that: they stop when the file fits.
What converting a file does to its size
Conversion is not compression, and the direction of the size change surprises people constantly.
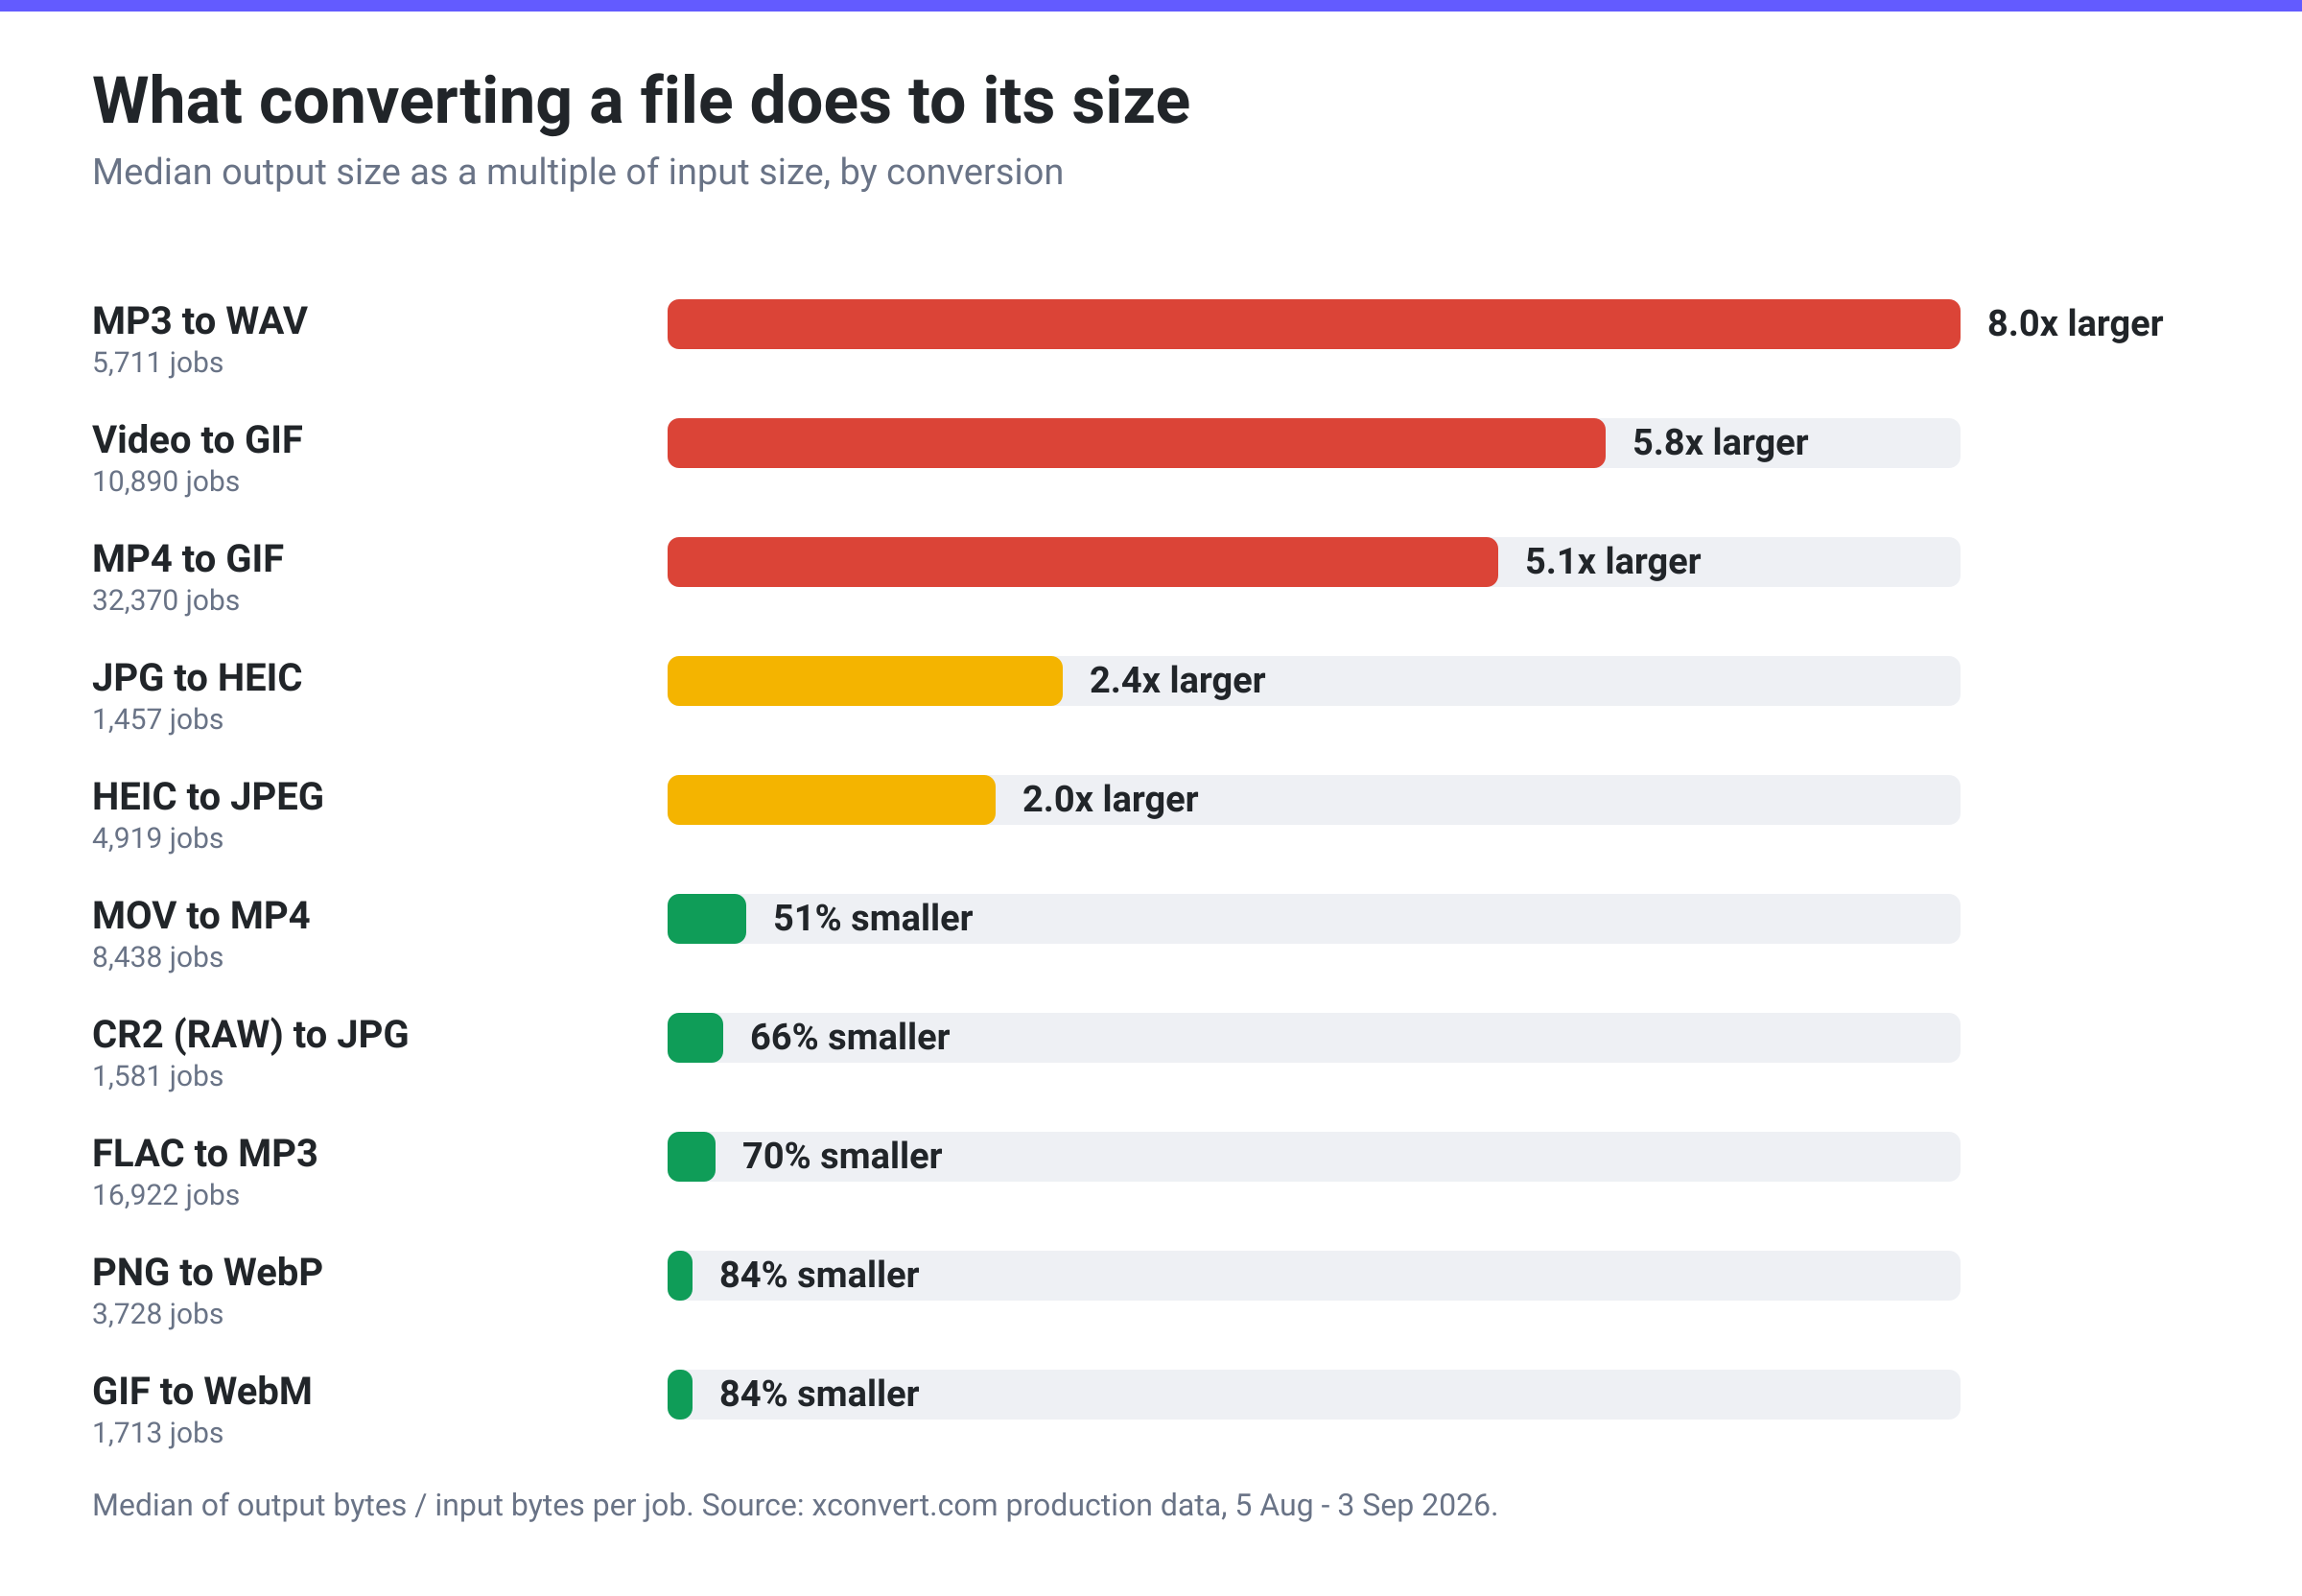
| Conversion | Jobs | Median input | Median output | Median change |
|---|---|---|---|---|
| MP3 to WAV | 5,711 | 0.83 MB | 4.3 MB | 8.0x larger |
| Video to GIF | 10,890 | 2.7 MB | 13.2 MB | 5.8x larger |
| MP4 to GIF | 32,370 | 3.6 MB | 14.9 MB | 5.1x larger |
| JPG to HEIC | 1,457 | 1.4 MB | 1.9 MB | 2.4x larger |
| HEIC to JPEG | 4,919 | 2.3 MB | 4.0 MB | 2.0x larger |
| MOV to GIF | 1,771 | 9.1 MB | 8.0 MB | 8% smaller |
| MOV to MP4 | 8,438 | 18.5 MB | 9.1 MB | 51% smaller |
| CR2 RAW to JPG | 1,581 | 33.1 MB | 9.7 MB | 66% smaller |
| ARW RAW to JPEG | 1,890 | 25.4 MB | 10.5 MB | 70% smaller |
| FLAC to MP3 | 16,922 | 23.2 MB | 6.3 MB | 70% smaller |
| WebP to MP4 | 7,186 | 10.3 MB | 1.6 MB | 79% smaller |
| JPG to WebP | 3,653 | 0.22 MB | 0.14 MB | 52% smaller |
| PNG to WebP | 3,728 | 0.88 MB | 0.11 MB | 84% smaller |
| GIF to WebM | 1,713 | 0.85 MB | 0.11 MB | 84% smaller |
The most-used conversion on the site is also the one that inflates files the most. A 3.6 MB MP4 becomes a 14.9 MB GIF at the median, because GIF stores every frame as an indexed image with no inter-frame compression. That is the single best argument for animated WebP or WebM where they are supported: the same GIF-to-WebM path cuts files by 84%.
Two rows deserve a note because they run against intuition. JPG to HEIC comes out 2.4x larger, even though HEIC is the more efficient codec, because a JPG that was already heavily compressed is being re-encoded at a high default quality; HEIC’s efficiency shows up on camera-original images, not on recompressed ones. And HEIC to JPEG doubles the file, which is the everyday price of compatibility every iPhone user pays when a form or a website will not accept HEIC.
How big files are in 2026
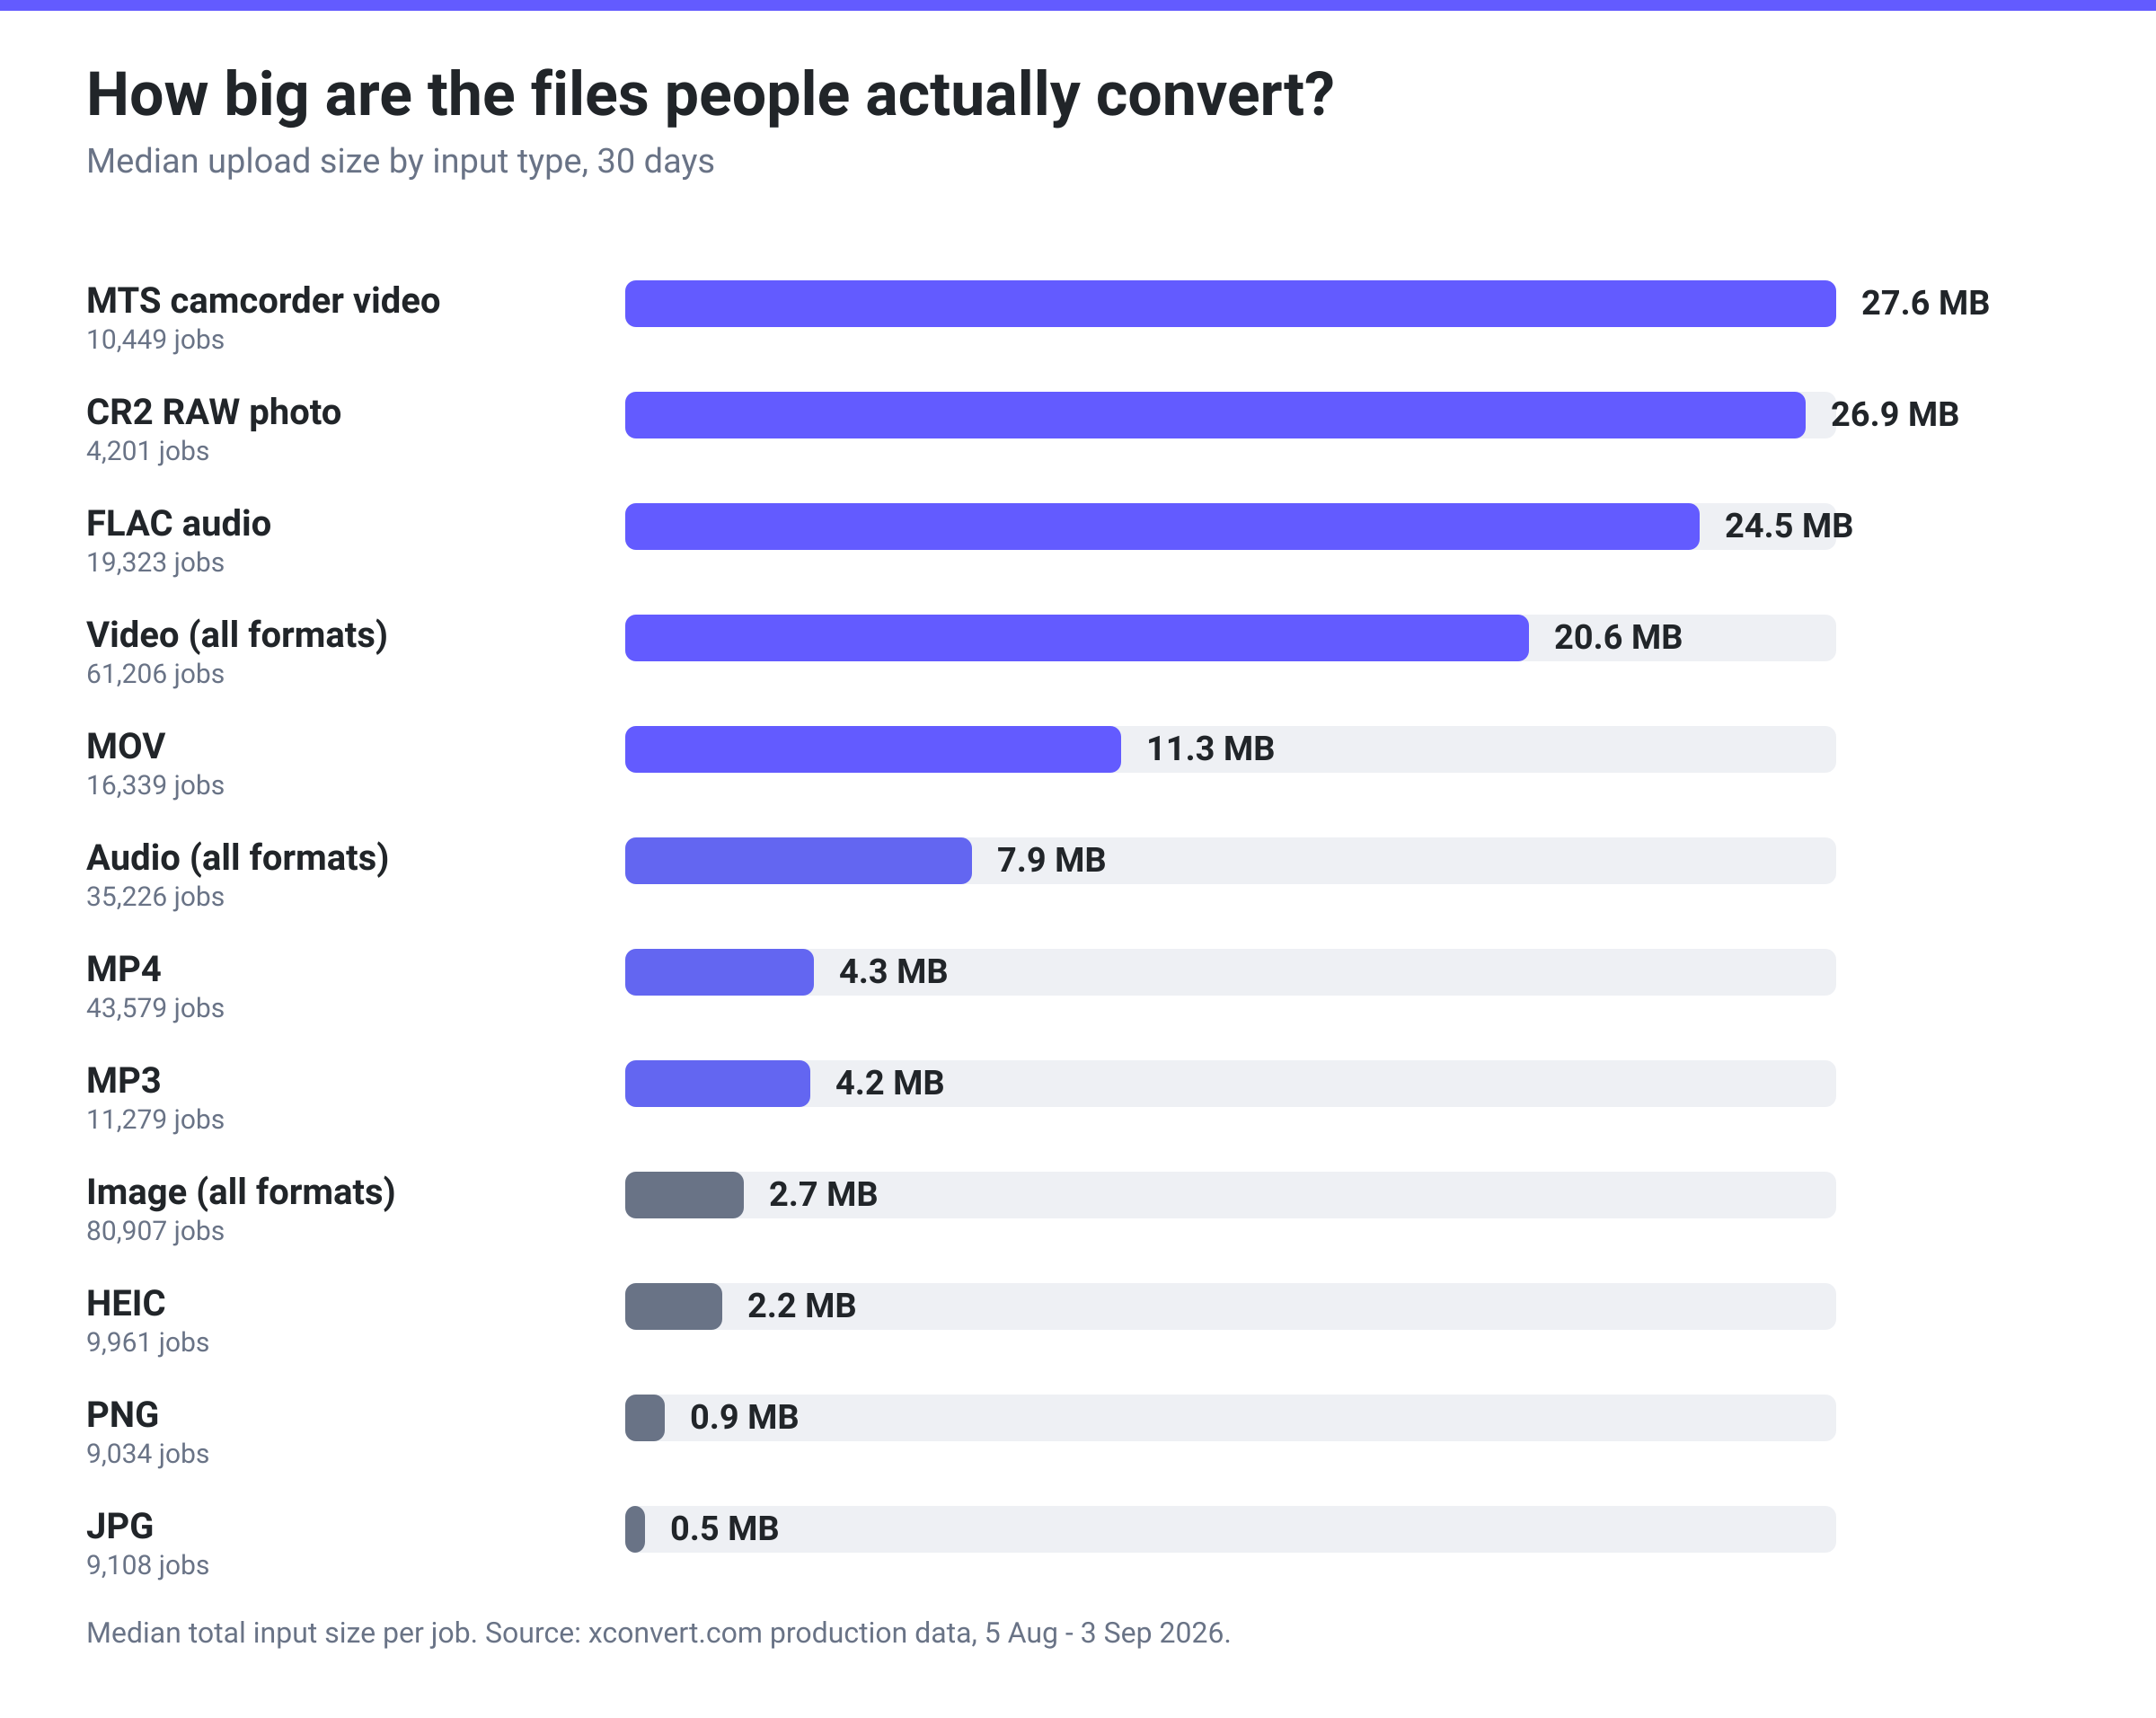
| Input type | Jobs | Median size | 90th percentile | 99th percentile |
|---|---|---|---|---|
| MTS camcorder video | 10,449 | 27.6 MB | 112 MB | 294 MB |
| CR2 RAW photo | 4,201 | 26.9 MB | 36.6 MB | 40.9 MB |
| ARW RAW photo | 2,767 | 25.4 MB | 49.4 MB | 84.0 MB |
| FLAC audio | 19,323 | 24.5 MB | 58.0 MB | 139 MB |
| TIFF | 1,041 | 23.9 MB | 91.3 MB | 290 MB |
| Video (all formats) | 61,206 | 20.6 MB | 215 MB | 470 MB |
| HEVC video | 1,937 | 19.3 MB | 122 MB | 343 MB |
| MOV | 16,339 | 11.3 MB | 101 MB | 310 MB |
| Audio (all formats) | 35,226 | 7.9 MB | 86.7 MB | 343 MB |
| WebP | 11,859 | 7.0 MB | 18.3 MB | 20.7 MB |
| MP4 | 43,579 | 4.3 MB | 36.4 MB | 223 MB |
| MP3 | 11,279 | 4.2 MB | 12.4 MB | 67.3 MB |
| Image (all formats) | 80,907 | 2.7 MB | 38.2 MB | 223 MB |
| Documents (PDF and office files) | 1,865 | 2.5 MB | 33.3 MB | 246 MB |
| HEIC | 9,961 | 2.2 MB | 5.0 MB | 26.5 MB |
| PNG | 9,034 | 0.92 MB | 7.2 MB | 88.9 MB |
| JPG | 9,108 | 0.46 MB | 5.7 MB | 71.9 MB |
The median photo is small; the tail is not. One image job in every 33 involved a file over 100 MB, and the largest single image processed in the window was 1.59 GB. Video is heavier across the board: 13,346 video jobs (22%) involved a file over 100 MB, 119 involved a file over 1 GB, and the largest was 3.88 GB. Audio’s tail is dominated by lossless and long-form files: 2,942 audio jobs exceeded 100 MB.
RAW photos are the most consistent large files on the list. A CR2 sits at 26.9 MB with almost no spread (the 99th percentile is only 40.9 MB), because the size is set by the sensor rather than by the scene.
Why people compress video: the platform limits
We looked at the 40,182 successful video compression jobs to see what people were actually up against.
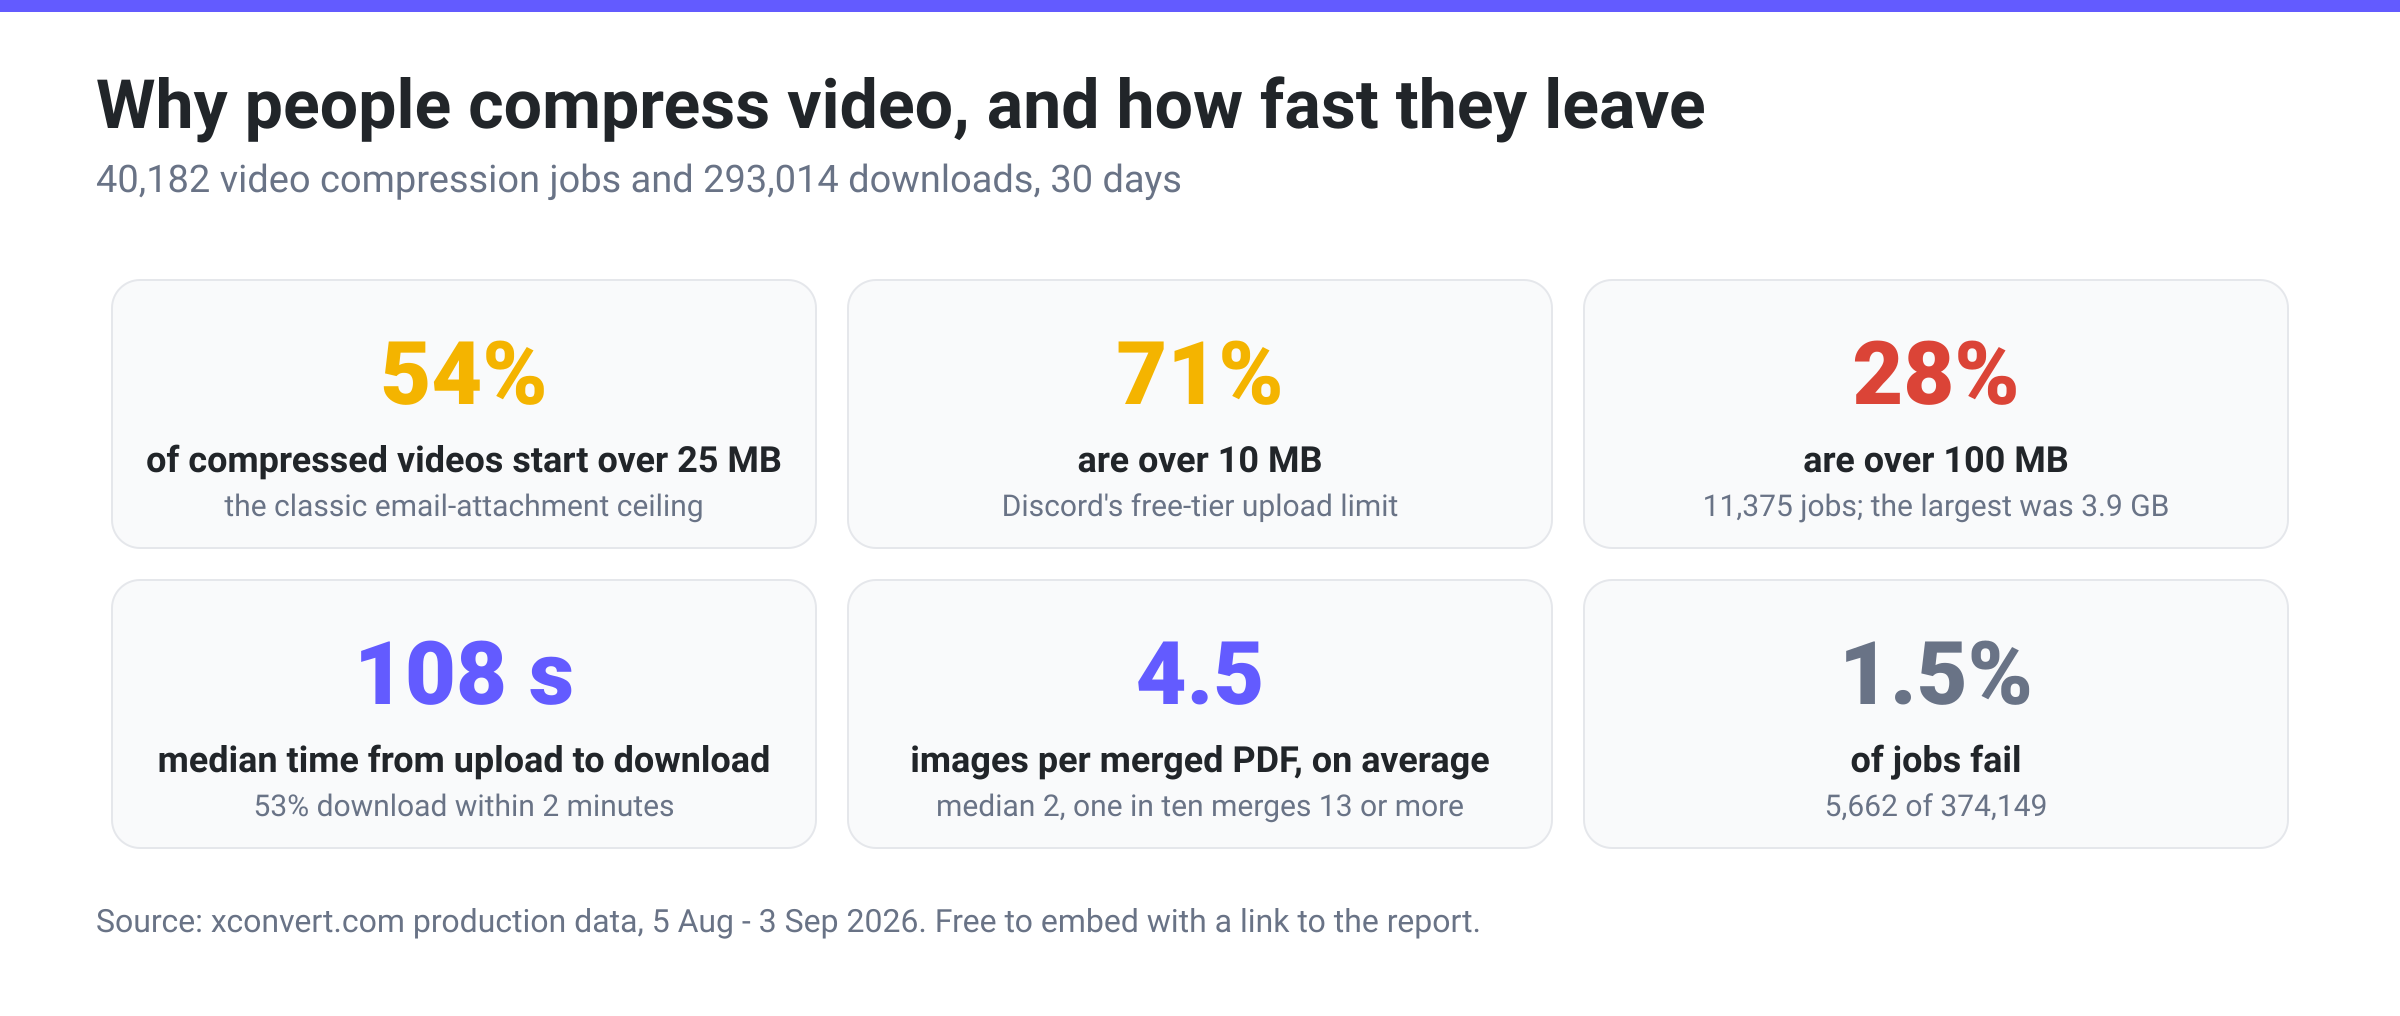
| Threshold | Share of input videos above it | Share of output videos at or below it |
|---|---|---|
| 8 MB | 74.7% | 43.6% |
| 10 MB (Discord’s free-tier limit) | 71.4% | 50.2% |
| 16 MB | 62.2% | 57.4% |
| 25 MB (the classic email-attachment ceiling) | 54.1% | 65.2% |
| 100 MB | 28.3% | – |
The median video arrives at 32.2 MB and leaves at 10.4 MB. Read the two columns together and the motive is obvious: 8,811 jobs took a file that was over 10 MB and delivered one under it, and 7,819 crossed the 25 MB line downwards. That is roughly one in five video compressions ending exactly where a Discord upload box or an email client stops complaining. If you need a file to land under a specific number, the compress a video to a specific size guide covers the target-size workflow, and the video compressor exposes it directly.
Merging, speed and behaviour
Merging. 13,872 jobs merged multiple files, overwhelmingly images into a single PDF. The average merge combined 4.5 files; the median was 2, one merge in ten combined 13 or more, and the largest combined 38 images. The median merged PDF came out at 737 KB – small enough to email, which is generally the point.
Speed. The median job finished processing in 21.3 seconds, and 90% finished within 93 seconds. Measured from upload to the user’s download click, the median was 108 seconds: 53% of users downloaded within two minutes and 86.7% within ten. Only 2.3% came back for their file more than an hour later.
Reliability. 1.5% of jobs failed. Failure is concentrated in a few hard formats: compress OGG failed 12.6% of the time, CR2 to JPEG 7.9%, compress WebM 3.8%, compress TIFF 2.2%. The busiest job on the site, MP4 to GIF, failed 0.6% of the time; WebP to MP4 failed on 4 jobs out of 7,206.
When and where files get converted
By hour. Activity is spread around the clock because the audience is global, but it peaks between 12:00 and 16:00 UTC (19,000 to 19,800 jobs per hour across the window) and bottoms out at 23:00 to 01:00 UTC (about 9,700 to 10,100). The quietest hour still carries half the load of the busiest.
By weekday. Normalised per day, Monday to Thursday run at 12,700 to 13,500 jobs, Friday dips to 12,500, Sunday to 11,500, and Saturday is the quietest day at 10,700 – 20% below Monday. File conversion is a working-week activity.
By country. The top ten countries by job count:
| Country | Jobs | Share |
|---|---|---|
| United States | 72,859 | 19.5% |
| India | 48,108 | 12.9% |
| Indonesia | 19,015 | 5.1% |
| United Kingdom | 15,705 | 4.2% |
| Canada | 13,702 | 3.7% |
| Philippines | 11,512 | 3.1% |
| Italy | 9,323 | 2.5% |
| China | 8,610 | 2.3% |
| Mexico | 8,209 | 2.2% |
| Pakistan | 7,899 | 2.1% |
Thirty countries each contributed more than 2,700 jobs in the window. The service is English-language, so these shares understate non-English-speaking markets relative to the world’s actual conversion needs.
Format trends: spring vs late summer 2026
Comparing the same 30-day window in March and April 2026 (5 March to 3 April) with the August window shows where demand on xconvert is moving. These reflect xconvert’s own traffic rather than the whole market, but the direction of several is hard to explain any other way.
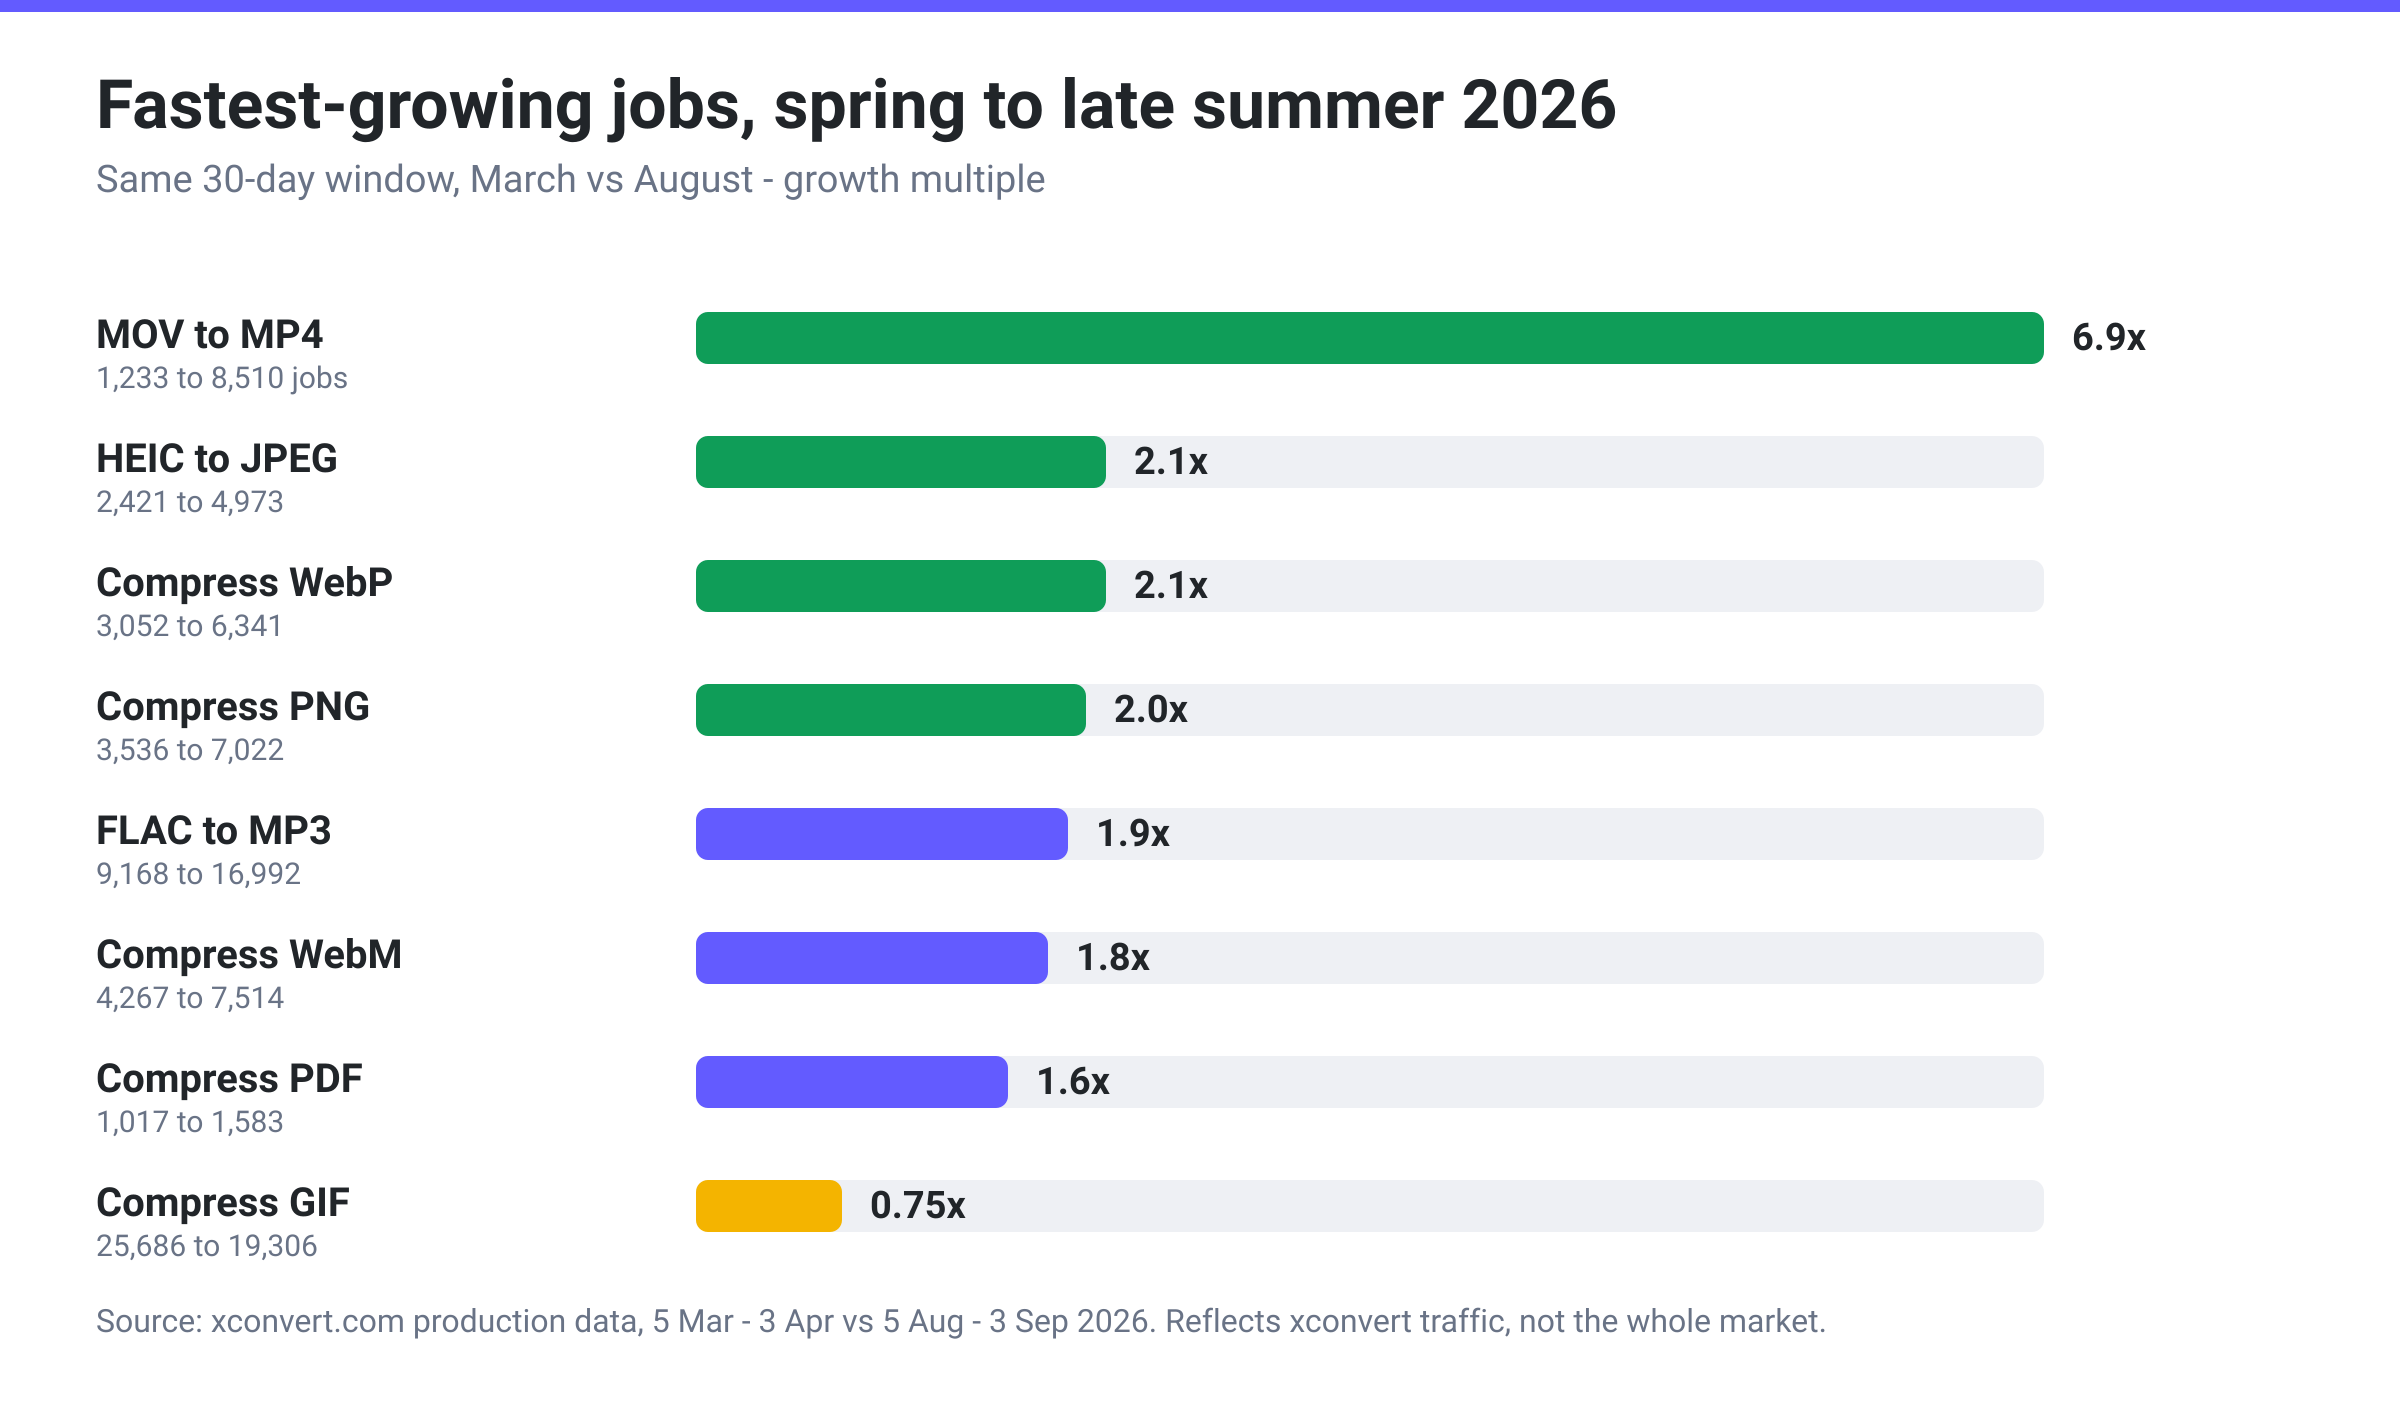
| Job | Spring window | Late-summer window | Change |
|---|---|---|---|
| MOV to MP4 | 1,233 | 8,510 | 6.9x |
| HEIC to JPEG | 2,421 | 4,973 | 2.1x |
| Compress WebP | 3,052 | 6,341 | 2.1x |
| Compress PNG | 3,536 | 7,022 | 2.0x |
| FLAC to MP3 | 9,168 | 16,992 | 1.9x |
| Compress WebM | 4,267 | 7,514 | 1.8x |
| Compress PDF | 1,017 | 1,583 | 1.6x |
| WebP to MP4 | – | 7,206 | new |
| Compress GIF | 25,686 | 19,306 | 0.75x |
The iPhone-to-everywhere pipeline (MOV to MP4, HEIC to JPEG) grew fastest, consistent with summer travel and video sharing. WebP work roughly doubled on both the compression and the “get me out of WebP” side, which is what you would expect as more sites serve WebP by default and more people end up with WebP files they did not ask for.
Methodology, citing and embedding
What was measured. Every job record in xconvert’s production database between 5 August 2026 00:00 UTC and 4 September 2026 00:00 UTC (374,149 jobs), plus lifetime totals to 4 September 2026 and a comparison window from 5 March to 4 April 2026. For each job we used the input and output file sizes, the source and target formats, the tool used, timestamps, the country resolved from the request, and whether the job failed or was downloaded. No file contents, file names or user identities were read or retained for this analysis; every figure is an aggregate.
Definitions. “Saving” is 1 minus (output bytes divided by input bytes) for a single job; the format figures are the median of those per-job values, not the ratio of totals, so one giant file cannot dominate a row. Medians and percentiles are computed with MongoDB’s approximate percentile accumulators, which are accurate to well under one percentage point at these sample sizes. Rows with fewer than 80 jobs are not reported. Weekday figures are normalised for the window containing five Wednesdays and Thursdays but four of every other day. Country is based on the request origin, which can be affected by VPNs.
Limits. This is xconvert’s traffic, not the internet’s. The audience skews toward people who arrived by searching for a specific conversion in English, so formats that are common but rarely converted (say, DOCX) are under-represented, and formats people are actively trying to escape (HEIC, WebP, GIF) are over-represented. The trend table compares two 30-day windows and is influenced by xconvert’s own product and ranking changes as well as by demand.
Refresh cadence. We plan to refresh this report quarterly with the same methodology, keeping the per-stat anchors stable so links keep pointing at the right number.
How to cite. “xconvert.com, File Conversion Statistics 2026” with a link to this page is all we ask. Suggested form:
Source: xconvert.com, File Conversion Statistics 2026 (374,149 conversions, Aug-Sep 2026)
https://www.xconvert.com/blog/file-conversion-statistics-2026/
How to embed a chart. Every chart on this page may be reproduced on your own site, in print, or in a presentation, with attribution linking back here. Copy any image and use it with a caption or link like this:
<a href="https://www.xconvert.com/blog/file-conversion-statistics-2026/">
  <img src="https://www.xconvert.com/blog/wp-content/uploads/2026/09/stats-headline.png" alt="File Conversion Statistics 2026 - source: xconvert.com" />
</a>
<p>Source: <a href="https://www.xconvert.com/blog/file-conversion-statistics-2026/">xconvert.com File Conversion Statistics 2026</a></p>
Need a number that is not here? Writers, researchers and journalists can ask for a custom cut of the data – a specific format pair, a size threshold, a country, a device type – by emailing [email protected] with “data request” in the subject. Straightforward requests are usually answered within a few working days, free, on the same attribution basis.
FAQ
How much does compressing a file usually reduce its size?
It depends almost entirely on the format. Across 138,300 real compression jobs, the median saving was 83% for PDF, 82% for TIFF, 71% for JPEG and PNG, 57% for GIF, 48% for MP4 video, 47% for audio and 25% for HEIC. Overall, compression removed 52% of all bytes submitted.
What is the most common file conversion?
On xconvert in August 2026 it was MP4 to GIF, with 32,594 jobs in 30 days, followed by compressing GIFs (19,306) and converting FLAC to MP3 (16,992).
How big is the average video file people upload?
The median video was 20.6 MB, but the distribution has a long tail: 10% of videos were over 215 MB, 1% over 470 MB, and the largest single file processed in the window was 3.88 GB. MP4 specifically had a median of only 4.3 MB, because so many MP4 uploads are short clips headed for GIF conversion.
Does converting MP4 to GIF make the file smaller?
No – it makes it much larger. At the median, a 3.6 MB MP4 became a 14.9 MB GIF, a 5.1x increase. GIF has no inter-frame compression. If you need a small animated file, converting to WebM or animated WebP cuts size by around 84% instead.
Why do so many people compress video?
Because of upload limits. 54% of videos brought to the compressor were over 25 MB and 71% were over 10 MB, and around one in five compressions delivered a file just under one of those two thresholds.
Can I use these statistics and charts?
Yes. Everything on this page is free to cite, quote and embed with attribution and a link to this report. Custom data cuts are available on request via [email protected].